OpenCV#
OpenCV is a popular image processing library. It has C++ and Python interfaces. This section focuses on the Python interface for interacting with OpenCV.
import cv2 as cv
import numpy as np
import matplotlib.pyplot as plt
Image#
The images in openCV are represented as matrices. As a linear algebra engine, it uses regular NumPy. OpenCV is therefore a set of functions for processing the NumPy matrices representing images. Regular NumPy transformations are usefull as well.
The following cell uses the OpenCV imread function to load the image and demonstrate that the output is a regular NumPy array.
img = cv.imread("open_cv_files/open_cv.png")
print(type(img))
img.shape
<class 'numpy.ndarray'>
(174, 290, 3)
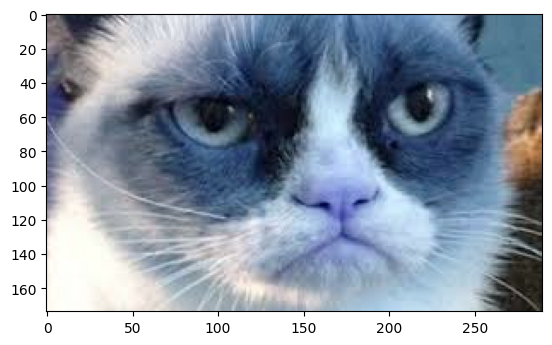
The matplotlib is suitable for rendering the array.
ans = plt.imshow(img)
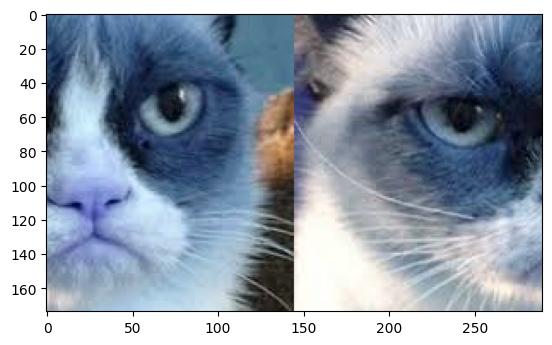
The following cell demonstrates how the standard NumPy functions are applied to the images:
shape = img.shape
ans = plt.imshow(
    np.concatenate(
        [
            img[:, int(shape[1] / 2):],
            img[:, :int(shape[1] / 2)]
        ],
        axis=1
    ),
)
Color spaces#
There are several ways to represent an image numerically - color spaces. OpenCV provies the cvtColor function to transform image colour spaces.
Check Color Spaces in OpenCV page of the documentation.
The following cell show the convertation of the regular RGB image into grayscale format.
image = cv.cvtColor(
    cv.imread("open_cv_files/open_cv.png"),
    cv.COLOR_BGR2GRAY
)
Each pixel now is represented with single number which is displayed in the following cell:
image.shape
(174, 290)
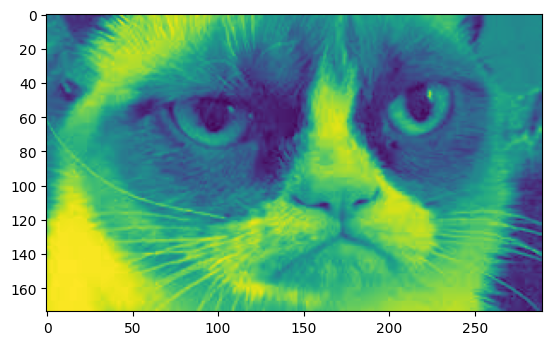
The usual three color layers are not present. Matplotlib also represents an image using its default yellow-to-green colours:
ans = plt.imshow(image)