matplotlib tables#
There is an option in matplotlib to create tables and save them as images - matplotlib.axes._axes.Axes.table.
This page contains some examples I’ve collected.
import pandas as pd
import matplotlib.pyplot as plt
From pandas#
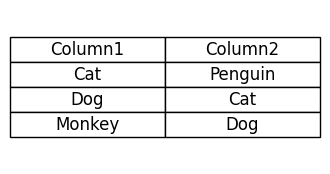
There is an example of turning pandas.DataFrame into a picture.
df = pd.DataFrame({'Column1': ['Cat', 'Dog', 'Monkey'],
                   'Column2': ['Penguin', 'Cat', 'Dog']})

fig, ax = plt.subplots(figsize=(4, 2))
table = ax.table(
    cellText=df.values,
    colLabels=df.columns,
    cellLoc='center',
    loc='center'
)
table.auto_set_font_size(False)
table.set_fontsize(12)
table.scale(1, 1.5)

ax.axis('off')

plt.show()
Colorful table#
You can setup colors for the table by using:
rowColours- for colors of the index of the table;colColours- for colors of the header of the table;cellColours- for colors of the content of the table.
width=10;height=10;

columns = ["{:X}".format(i) for i in range(width)]
rows = ["{:02X}".format(10 * i) for i in range(height)]

content = [
    [f"{c}, {r}" for c in range(width)]
    for r in range(height)
]
colors = [
    [(c/width, r/height, 0.5) for c in range(width)]
    for r in range(height)
]

fig, ax = plt.subplots()
ax.set_axis_off()
table = ax.table(
    cellText = content,
    rowLabels = rows,
    colLabels = columns,
    rowColours =["red"] * 10,
    colColours =["palegreen"] * 10,
    cellColours=colors,
    cellLoc ='center',
    loc ='upper left'
)

ax.set_title(
    'matplotlib.axes.Axes.table() function Example',
    fontweight ="bold"
)

plt.show()
