Matplotlib#
Matplotlib is a comprehensive library in Python for creating static, animated, and interactive visualizations. It’s widely used for data visualization in the scientific and engineering communities. Below is an introduction to Matplotlib, covering installation, basic usage, and some example plots.
import matplotlib.pyplot as plt
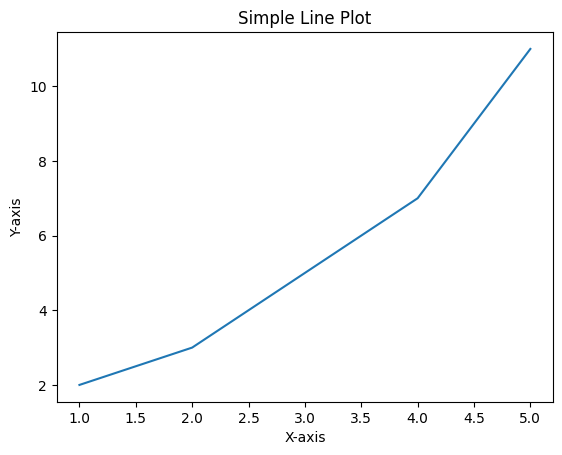
Line plot#
# Data for plotting
x = [1, 2, 3, 4, 5]
y = [2, 3, 5, 7, 11]

# Create a plot
plt.plot(x, y)

# Add a title and labels
plt.title('Simple Line Plot')
plt.xlabel('X-axis')
plt.ylabel('Y-axis')

# Show the plot
plt.show()
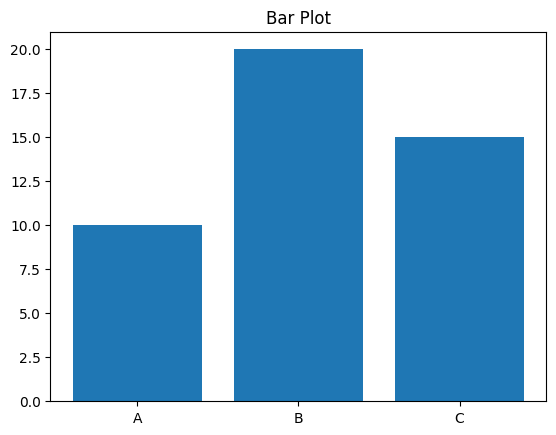
Bar plot#
# Data for bar plot
categories = ['A', 'B', 'C']
values = [10, 20, 15]

plt.bar(categories, values)
plt.title('Bar Plot')
plt.show()
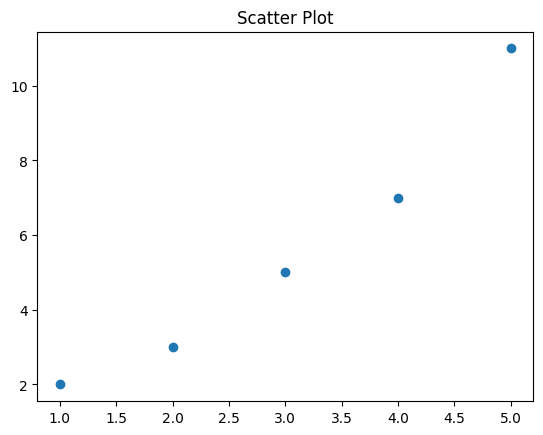
Scatter plot#
# Data for scatter plot
x = [1, 2, 3, 4, 5]
y = [2, 3, 5, 7, 11]

plt.scatter(x, y)
plt.title('Scatter Plot')
plt.show()
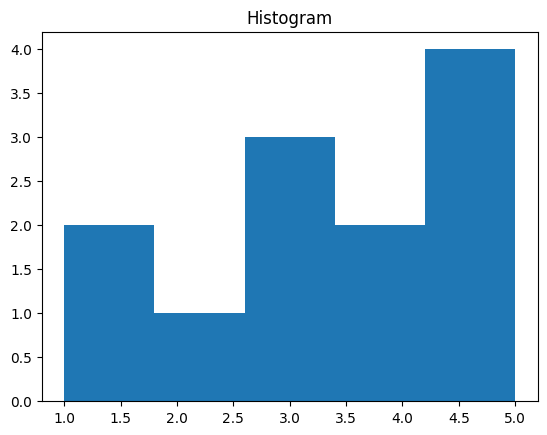
Histogram#
# Data for histogram
data = [1, 1, 2, 3, 3, 3, 4, 4, 5, 5, 5, 5]

plt.hist(data, bins=5)
plt.title('Histogram')
plt.show()