Data visualisation#
Pandas has some integration with matplotlib. It’s difficult to create advanced plots from pandas, but for purposes of instant visualisation it can be helpful.
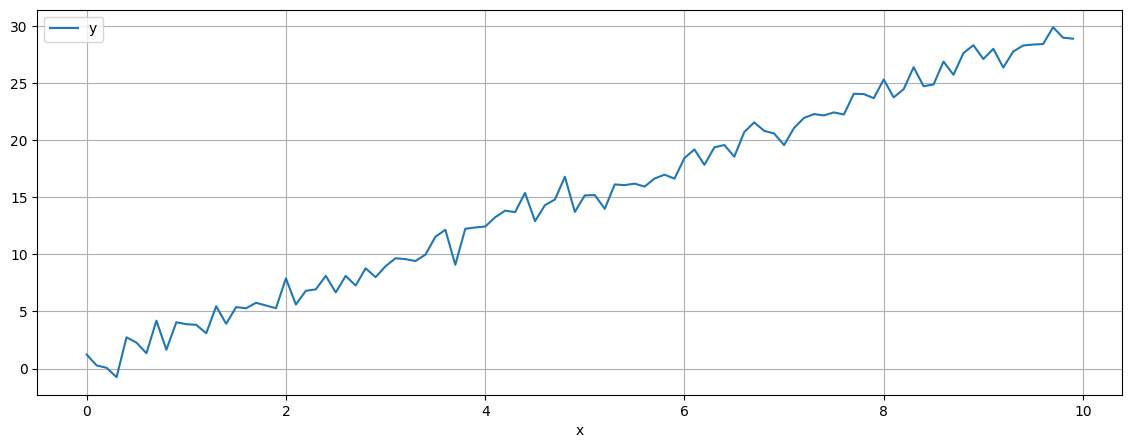
plot#
pandas.DataFrame has a plot function that is only for line plots using variables from the dataframe. You can specify:
xvariable name for x-axis, x-axis title will be the same;yvariable name for y-axis, y-axis title will be the same;figsizeto adjust the size of the diagram;Many parameters used in the classic
matplotlib.pyplot.plotfunction.
import numpy as np
import pandas as pd


x = np.arange(0, 10, 0.1)
df = pd.DataFrame({
    "x" : x, 'y':x*3 + np.random.normal(0, 1, len(x)),
})

ans = df.plot(
    x="x", y="y",
    figsize = (14,5),
    grid = True
)
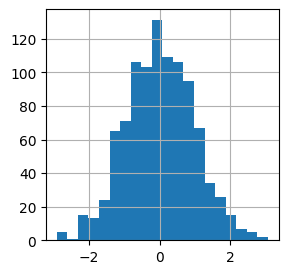
hist#
You can create a histogram based on the values of some pandas.Series from this object only.
The arguments are really close to matplotlib.hist except that:
figsizeyou can set figure size just from that function.
So in the following example, I use all these features to show the skewness of a normally distributed variable.
import numpy as np
import pandas as pd

vis_ser = pd.Series(np.random.normal(0, 1, 1000), name = "some variable")
ans = vis_ser.hist(bins = 20, figsize = (3, 3))