Random distributions#
In torch there is a set of functions that allow you to generate tensors with random values distributed according to the given distribution.
import torch

import seaborn as sns
import matplotlib.pyplot as plt
Uniform#
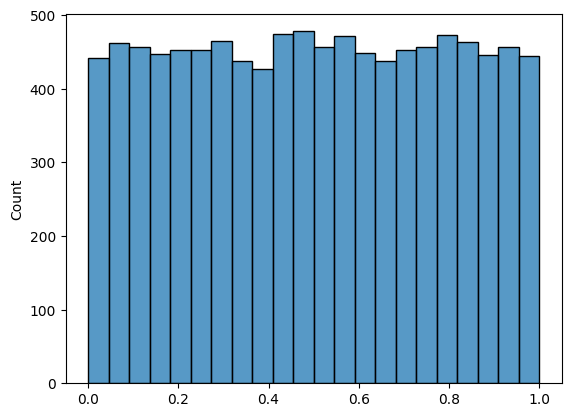
For createing uniform distributed tensor you have to use torch.rand function. The result will be randomly generated values with a uniform distribution from 0 to 1.
The following graph shows the histogram for generation.
sns.histplot(torch.rand(10000))
plt.show()
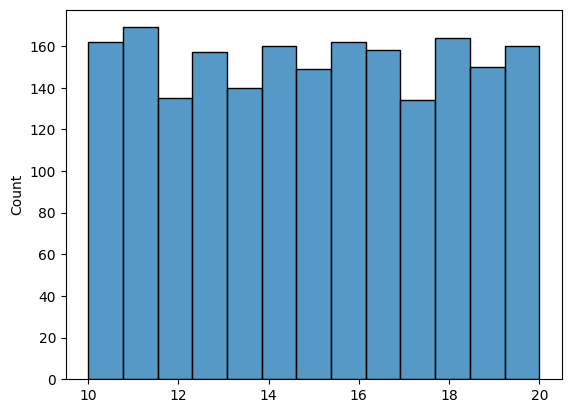
It appears that Torch doesn’t have a built-in function to directly generate uniformly distributed values with specific parameters. However, it’s relatively simple to implement using the formula:
The following generates an array that follows the distribution \(N(10, 20)\):
a = 10
b = 20

generation = a + (b - a)*torch.rand(2000)
sns.histplot(generation)
plt.show()
Normal#
For generating normally distributed arrays, you can use the following functions:
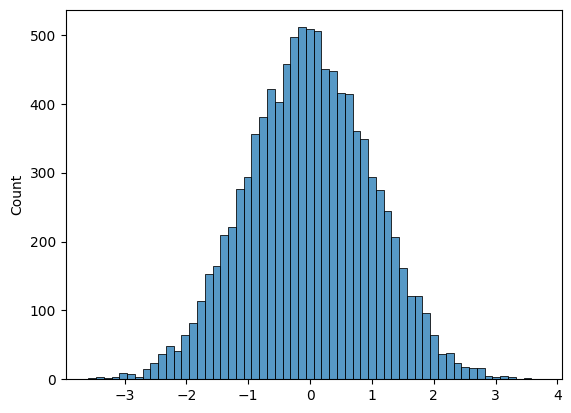
torch.randn: generates an array that follows the \(N(0, 1)\) distribution.torch.normal: generates an array that follows the \(N(\mu, \sigma)\) distribution, where \(\mu\) and \(\sigma\) are specified values.
The following cell demonstrates the usage of the torch.randn function.
sns.histplot(torch.randn(10000))
plt.show()
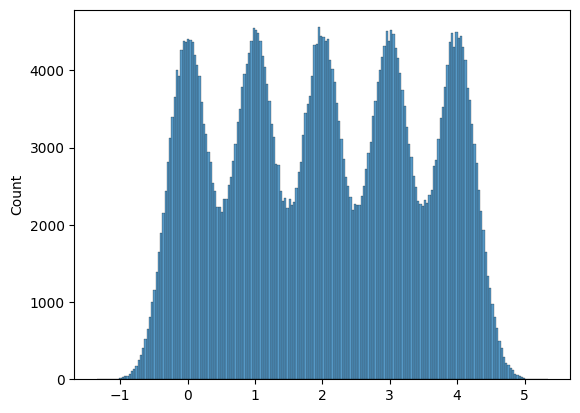
Here are several arrays generated by torch.normal with different parameters, displayed on the same plot.
sns.histplot(
    torch.cat([torch.normal(i, 0.3, [100000]) for i in range(5)]),
    bins=200
)
plt.show()